Numbers every distributed system engineer should know
Intro
System engineers deal with numbers related to computers every day. It comes up at work, in design conversation, in casual conversations about tech, in system design interviews, etc.
In this short post, I aim to reference some types of numbers that I find useful. These are related to computer systems, including distributed systems.
Basic conversions
-
unit = m (milli) = µ (micro) = n (nano)
-
unit = Thousand (K) = Million (M) = Billion (B) = Trillion (T) = Peta (P)
-
1B KB = MB = GB = TB = PB
-
1K | 1M | 1G | 1T | 1P
-
| | | |
-
2.5Msec in 1 month, because
-
2.5M requests/month 1 request/sec
-
100K seconds in 1 day
-
1M requests/day 10 requests/sec
-
1 Byte = 8 bits1
Binary prefixes
KB is different than KiB; MB is different than MiB; and so on.
What’s the difference? See the table below, which is taken from here:

Read more details here.
Powers (2^N, 10^N)
My notes on power of two and ten:
Component limits (throughput, latency)
This is mostly based on empirical evidence from experimentation. Some of these could also be hard coded at the hardware (by vendor) or software (kernel, firmware, driver) level.
These numbers are based on my machine, which as of 02/21/2024, has:
- CPU: AMD Ryzen 7 3700X (16) @ 3.600GHz. 8 cores but 16 with hyper threading.
- Memory: Corsair Vengeance LPX 32GB (2x16GB) 3200MHz C16 DDR4
- Disk: SAMSUNG 970 EVO Plus SSD 1TB NVMe M.2
- Network: See page 10 of my motherboard manual
- OS: Linux kernel 5.15.0-88-generic
Numbers:
- L1/L2/L3 size: 512KiB, 4MiB, 32MiB
- L1 latency ~ 1ns (4 cycles), L2 latency ~ 5ns (20 cycles), L3 latency ~ 20ns (80 cycles)
- Cache line size: 64B (bytes)
- Main memory latency ~ 100ns (400 cycles)
- Kernel memory page size: 4KiB (in userspace, allocator gives me virtual memory in 4KiB chunks/slabs)
- CPU <-> Main Memory bandwidth ~ 25-50 GiB/s
- Syscall overhead ~ 300ns (this is mostly because of CPU mode switch from user to kernel space and then back). This is a very nuanced topic, see 1, 2, 3.
- Kernel thread scheduler overhead ~ 1-2us depending on CPU pinning so ~4000 cycles (kernel has O(1) scheduler so ideally this time should remain constant as number of threads increase)
- Memory overhead of a thread ~ 2MiB (includes instructions for pthread_t, kernel stack, user space stack, thread specific data). Note that
ulimit -sgives max stack size of a thread, which is typically set to 8MiB, after which you’ll get stack overflow. - Mutex lock/unlock - syscall overhead + kernel cpu time ~ 25ns (100 cycles).
- Compress 1K bytes with Zippy ~ 10us
- For disks, IOPS must be used in the context of block size. Throughput (bytes/sec) is a good metric but doesn’t tell the whole story since it depends on your block size, how you’re doing IO, device driver, etc. See https://spraza.com/posts/ssds/.
- For networks, a lot of factors affect performance: hw (NIC, network provider infrastructure), physics (distance, src and dst, speed of light), sw (protocol, kernel overhead, buffer memory copies). From localhost to localhost via kernel, latency ~ 0.05ms. From host to host (same subnet), latency via 10Gib/s Ethernet is 0.2ms - on Wifi it’s ~3ms (because bandwidth is ~700Mb/s sometimes written as 700Mbps). From SF to NYC, latency over the ijnternet is ~40ms, SF to UK it’s ~80ms, SF to Australia it’s ~183ms, SF to Europe is roughly ~150ms. Note these latencies are rtt (round trip times) of ping packets. Having said all this, within the same data center (DC), the latency is generally 0.5ms-1ms, depending on where the src and dst machines are and whether they share a rack. Now in terms of throughput, it depends on how big packets you’re sending, what protocol you’re using, and what the src/dst regions are. But as an example, …
WARNING
If you’re reading this, keep in mind that these numbers are just to get a sense of the shape of computer bottlenecks. If you’re basing your system’s design based on any such numbers, I would warn and advice you to:
- First understand what you want your system to do for you, what capacity you have and what kind of machines you have. Pick a time horizon of a few years.
- Talk to your customers and understand their workloads.
- Come up with system level API success metrics. It can be API throughput or latency or cache freshness, etc.
- For all the workloads you want to target, understand what should be the range of values for system level metrics to satisfy your customers.
- Only once you have this, you go further: now you want to understand based on the architecure/design of your system, what will be the bottleneck for different kinds of workloads. Understand the physics of these bottlenecks e.g. CPU to Memory latency is bound by speed of light, so you may want to avoid main memory hits and come up with a more cache friendly design. Another way to look at it is: for a given workload, what’s the scaling factor of your system? E.g. if I give you a CPU with twice as fast clock rate, does your system’s performance (according to success metrics above) scale linearly? You should also understand that if a particular bottleneck in a component goes away (because of better system design or faster component), then what’s the next bottleneck.
The last point is where these component level numbers are helpful. In practice however, at some point you develop more intution to go backwards: based on the numbers, you can come with a good design and match your design’s strengths with what people around you (your customers) need from the system.
Another note on measurement:
- when you measure, understand with high precision what’s being measured. E.g. if it’s API latency, does it include network, does it include time spent in kernel network queue, etc.?
- then also understand how it’s being measured. E.g. if your observability or metrics system is polling some in-memory counter every few seconds, then does it capture the values in between when the polling happens? Are there other statistics that you can trust e.g. p99. Is the data used for metrics reporting being sampled?
Trends
- Brendan Gregg’s talk on computing performance on the horizon
- Go through time (1990 - present) to see how fast computer components have become.
- SSDs Have Become Ridiculously Fast, Except in the Cloud
More resources
Availability
There are multiple ways to measure this. One simple way is, for some definition of acceptable, what’s the percentage of acceptable responses that your service gives?
For example, service availability would mean that of the time, your service is returning unacceptable responses (e.g. 5xx, or no response like timeouts).
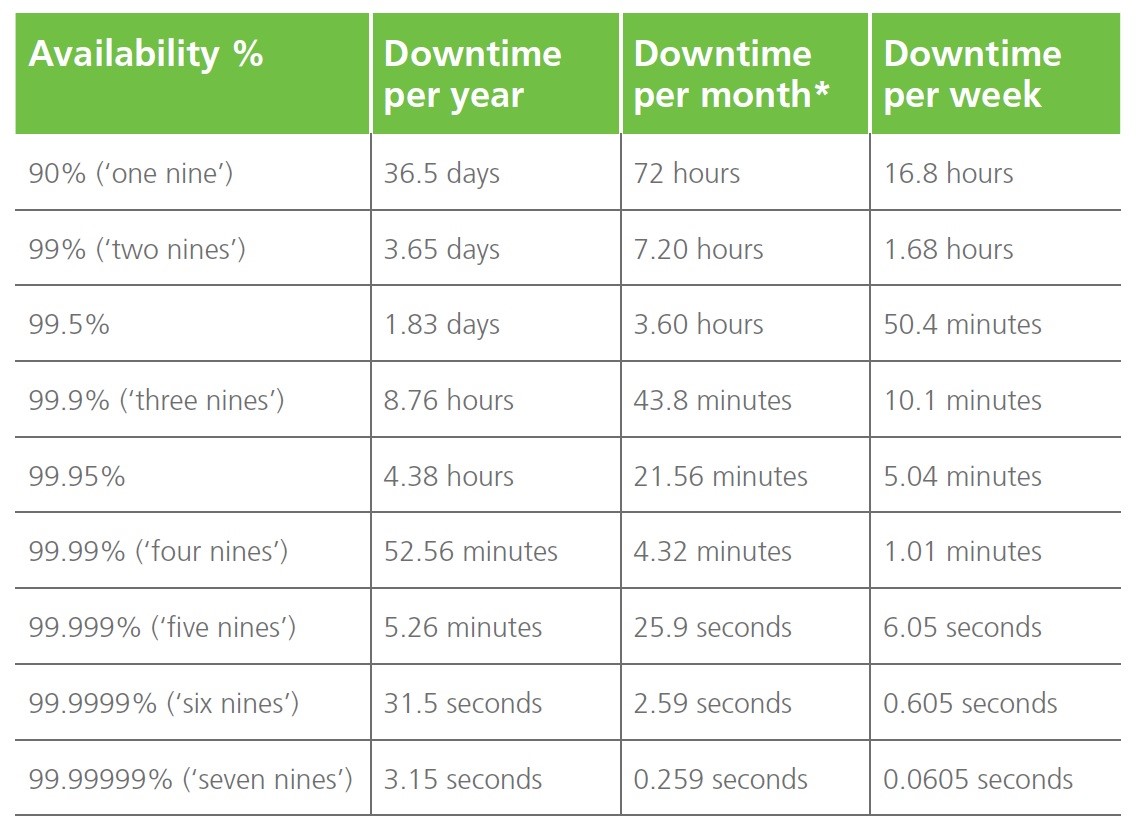
These percentages are often talked about as “number of 9’s”. Here is a table (taken from here) of what adding 9’s means for the time a service can be unavailable (aka downtime):

An interesting observation here is how the service downtime decreases as the numbers of 9’s increase.
availability (or downtime) means that the service will be unavailable th of the time.
availability (or downtime) means that the service will be unavailable th of the time.
availability (or downtime) means that the service will be unavailable th of the time.
This means that each time you add a , the new downtime is th of the old downtime. For example, if means around hours of downtime per year. Adding a 9 (i.e. ) means around hour of downtime, which lines up with the table (showing around minutes).
Taking a service to 8 hours per year downtime is hard. Taking it to hour is even harder. Adding another , meaning minutes of downtime (per year!) is much much harder. Overall, adding a exponentially increases the difficulty in creating (and maintaining) a system that satisfies the new availability threshold.
Further reading
There are things like Apdex which you can use if you want finer grain control over “acceptable” vs “tolerable” vs “unacceptable”.
You can read more about service availability here.
Another great read: https://sirupsen.com/napkin
Fun
-
Fun quiz by Julia Evans on how much can computers do in a second. See how many you get right.
-
Try this in your command line:
|
|
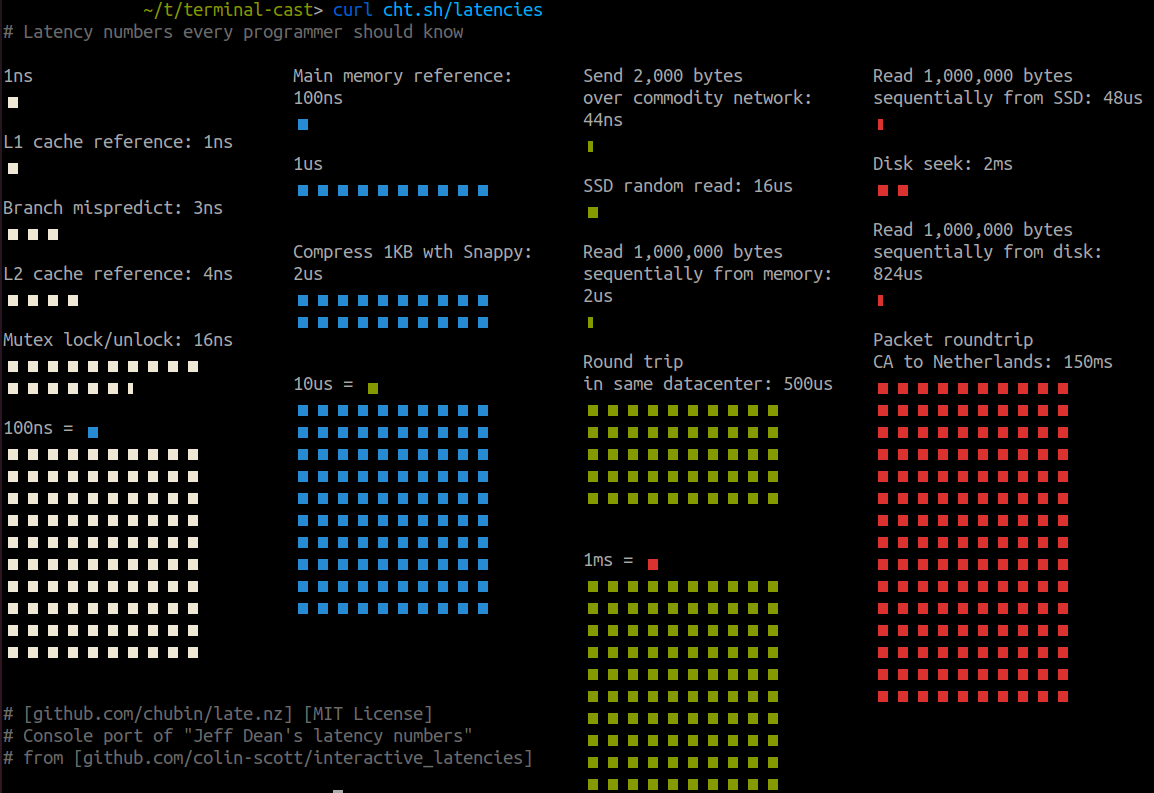
You should see something like:
